Technical analyze of assets
Technical analyze, aka TA is not so boring or difficult as you may think. But…
What is TA?
- TA is stock or commodity market technique analyzing market action such as price, trading volume and market interest.
- In stock exchange, TA analyses past price changes hoping to forecast future price changes
Let us be honest. Technical analysis and trading look difficult. But…
Buying or selling is more than joining lines in TA and exists for thousands of years.
TA mostly focuses on price alone. Not on fundamental metrics and analysis with tokenomics, network activity, teams, macro economics, partnerships, … as used by HODL people who seek to evaluate the long term price of an asset.(Hodl is slang in the cryptocurrency community for holding a cryptocurrency rather than selling.
The candlestick chart, which is one of the most used TA methods, was invented by a Japanese genius trader going by the name of Hunma Munehisa. He described and defined the main streams of market psychology, still used today.
Human psychology, fear and greed follow patterns… they can be predicted. Which brings us to short and long term movements. Use both TA and fundamental analysis to gauge your assets in general.
Charles Dow brought those principles into the western markets and founded wall street journal. THE Dow Jones is named after him!
The crypto market is very volatile, speculative and drives mainly on emotions… which makes it even harder to predict and follow up. All depends on of your choices.
What is a candlestick chart?
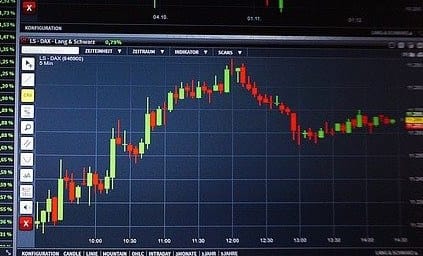
A candlestick chart is used by traders all over the world to gauge the price of an asset.
One candlestick represents a unit of time (variable) and according to its length up or down traders will take profits and prices may drop/or buying the dip with prices going up.
Green = buy
Red = sell
But…
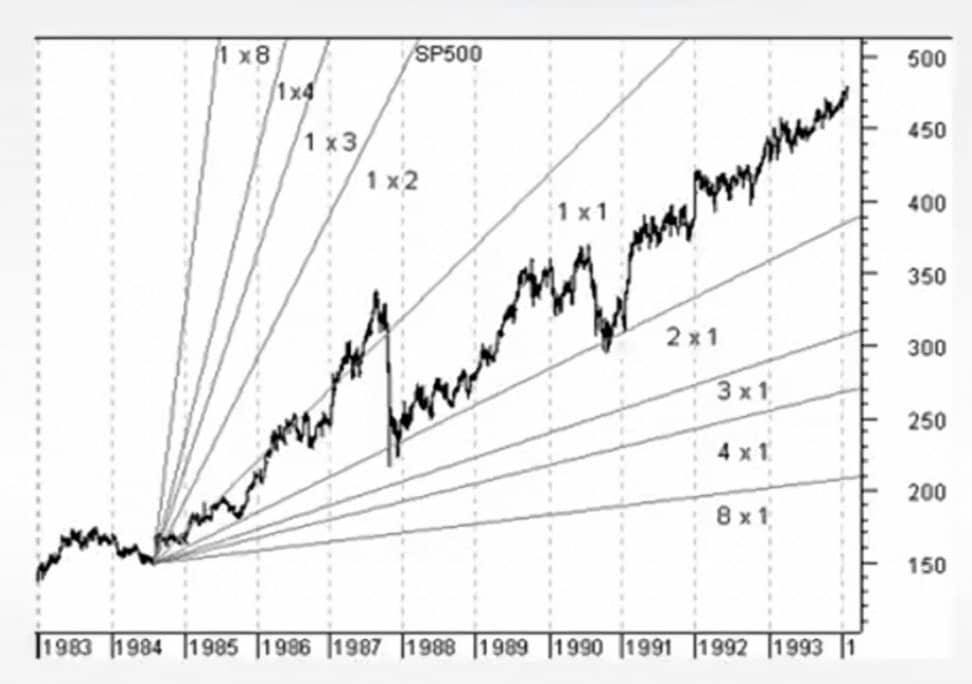
Support, resistance lines can be drawn, giving some perspective on future evolution of the prices.
And Trading volumes do sustain the price trend and confirm the price changes.
Triangle patterns are the most reliable tools, determining resistance and descending or support and growing.

Some great indicators on the short term
Moving averages, with average prices over time (EMA) with dead and golden crosses
MACD also studies the averages and seeks to valuate the trends
RSI shows over and under valuated assets
Bollinger Bands shows volatility
Your trading strategy will be based on all of those… buying dips or selling profits.
CHECK SOME INTERESTING AFFILIATE LINKS
Forex
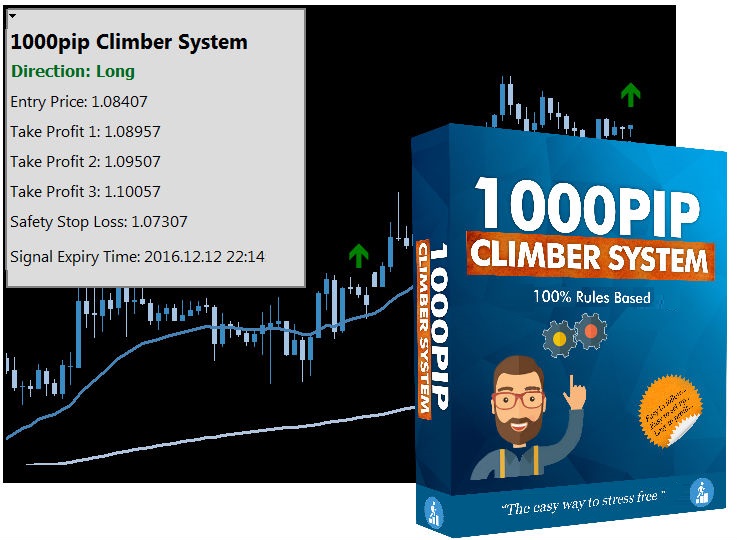
Automatic detection with entry, stop loss and take profit values

THE EASY WAY TO FOLLOW FOREX
The 1000pip Climber Forex System is a state of the art algorithm, designed to make it as easy as possible to succeed at Forex. The Forex system continuously analyses the FX
Trading Brain trainer
use daily to train your brain to easily recognize candlestick patterns and predict changes for trading success.
Crypto Ultimatum
Methods FOR FREE To Make Huge Money Only Using Bitcoin and Other Cryptocurrencies. And I4 things used to scam You regarding cryptocurrencies.
THANK YOU FOR LIKES, SHARES AND COMMENTS
Tell us, what is your experience with TA?

Invest in your future & learn
Learn affiliate marketing & build your own website.
Heads up! Make sure you sign up using my referral link to get access to my personal coaching and all features.
👉 Sign Up


